Table of contents
- Azure Monitor
- Azure VM Insights Monitor logs
- What is the relationship between all Azure native monitoring tools?
- Plan the implementation of the Log Analytics workspace
- Different levels of access control for the aggregated logs
- Azure collects compute monitoring data through agents.
- Create and configure a Log Analytics workspace
- How to enable Azure Monitor VM Insights and also onboard a virtual machine in the Log Analytics workspace.
- Creating log queries with Kusto Query Language
Azure Monitor
Azure Monitor Logs collect and organize log data generated by Azure resources. Log data is stored in the Log Analytics workspaces. You can query data in workspaces for trending, reporting, and alerts.
Examples of captured data include Windows event logs, heart rate logs, performance data, and system logs.
Azure VM Insights Monitor logs
Azure Monitor VM Analytics is an Azure Monitor feature that relies on Azure Monitor logs. Think of Azure Monitor VM Insights as a feature that offers a structured, pre-built monitoring experience that requires minimal configuration. Azure Monitor VM Insights uses a table called Insights Metrics. Administrators can use this table to query the performance and utilization of virtual machines. The data generated allows you to view everything in a meaningful way. Administrators can also use Azure Monitor VM Insights to process log data without exposing the underlying queries.
What is the relationship between all Azure native monitoring tools?
There are several resources and services available that complement the native Azure monitoring toolkit. Azure Monitor will be the primary service, which will include all monitoring tools and everything else below it. The service collects and analyzes the data generated by your Azure resources. Azure Monitor acquires monitoring data from the following sources:
- Azure resources
- Azure subscription
- Azure tenant
The data collected by Azure Monitor consists of Azure Monitor metrics and logs from Azure Monitor logs. Azure Monitor Metrics are lightweight numbers stored in a time series database that can be used for near real-time alerts. Examples of captured metrics are the IOPS ratio and CPU cycles.
As explained earlier, Azure Monitor Logs collect and organize log data from Azure resources. The main difference between Azure Monitor Metrics and Azure Monitor Logs is the structure of the data produced.
When your data is in metrics or records, there are many ways to view, analyze, take action, integrate and visualize the overall health of your assets. In addition to logs and metrics, Azure resources also release Azure platform logs collected by Azure Monitor. Platform logs provide comprehensive diagnostic and auditing information for Azure resources and the Azure platform. The platform logs are resource logs , activity logs, and Azure Active Directory logs. All resources automatically create platform logs. Administrators may need to configure some platform logs to be routed to one or more destinations to be maintained.
Plan the implementation of the Log Analytics workspace
One of the activities involved in implementing Log Analytics is choosing the right design. A Log Analytics workspace is a container where Azure Monitor data is collected, aggregated, and analyzed. There are also Azure resources that can send platform logs and Azure activity logs to the workspace. The best strategy is to determine the total number of workspaces needed for daily operations. Reducing the number of workspaces makes the management and query experience easier and faster. Some companies may need to design multiple workspaces.
Different levels of access control for the aggregated logs
Access mode:
This includes how users access the Log Analytics workspace and how the data scope is defined
Access control mode:
Defines how permissions for a specific workspace work in Log Analytics
RBAC at the table level
Other permissions listed in the table provide a mechanism to define more granular data in the Log Analytics workspace for greater control.
Azure collects compute monitoring data through agents.
Compute resources in Azure require multiple agents to collect monitoring data in Log Analytics and Azure Monitor. Each agent enables customers to measure the performance, responsiveness, and availability of guest operating systems and core workloads. The following table lists each agent.
Azure Monitor Agent
Collect monitoring data from guest operating systems in virtual machines and send the data to Azure monitor logs and metrics.
Log analysis agent
Collect logs and performance data for virtual machines in Azure, other clouds, or on-premises
Azure Diagnostic Plugin
Clients can receive additional data from guest operating systems and workloads residing on compute resources.
Dependency agent
Collect detection data on specific processes running on virtual machines
As mentioned above, you need to configure Azure Monitor VM Insights for the Log Analytics workspace. Azure VM Insights Monitor is a new service that provides additional visibility and functionality for collecting data from virtual machines.
How to deploy a Log Analytics workspace with appropriate access controls
Create and configure a Log Analytics workspace
1.Find and select Log Analytics workspace in the Azure portal.
2.Select Create.
3.Enter the following values to create a Log Analytics workspace.
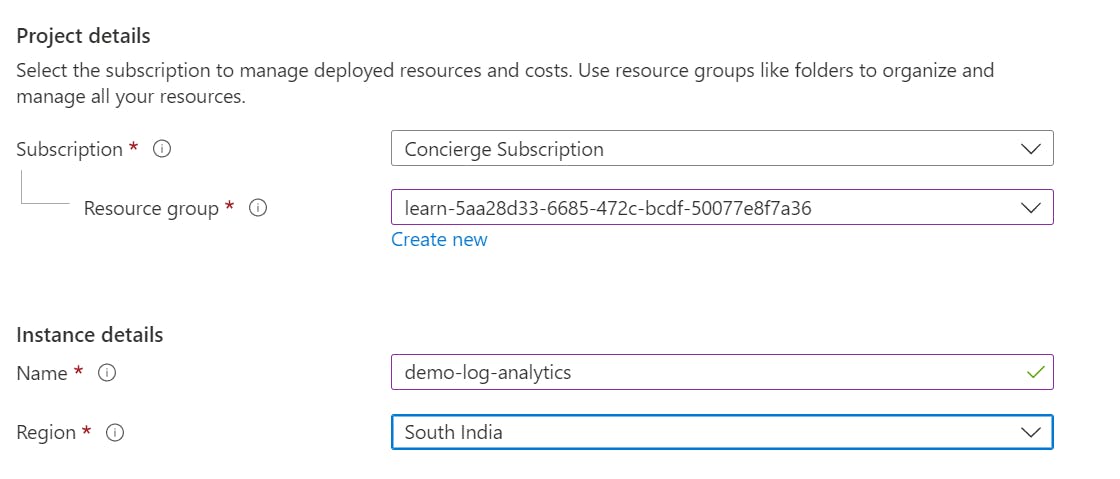
4.Select Review + Create > Create.
5.After the resource is published, select Go to resource.
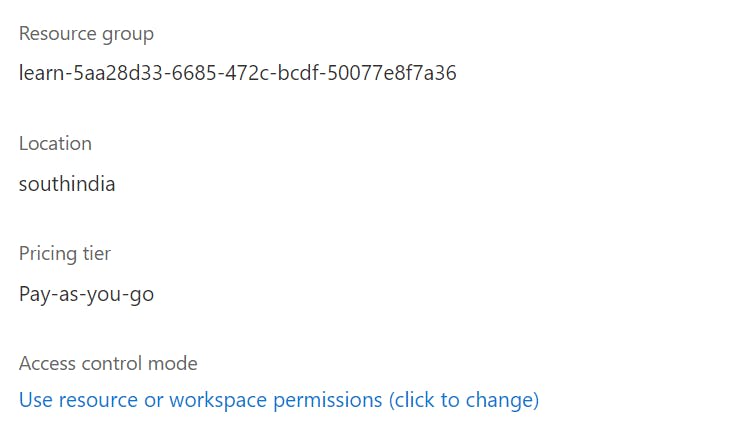
In the left menu under General, select Properties. Find out how to control access and select Use workspace or resource permissions. This setting changes the access mode to use the resource context.
How to enable Azure Monitor VM Insights and also onboard a virtual machine in the Log Analytics workspace.
Set your environment
1.Run the following command in Azure Cloud Shell:
az vm create \
  --resource-group learn-5aa28d33-6685-472c-bcdf-50077e8f7a36 \
  --location southindia \
  --name demoVM1 \
  --image UbuntuLTS \
  --admin-username azureuser \
  --generate-ssh-keys \
  --verbose
2.After demoVM1 is finished, run the following command in the Azure Cloud Shell:
az vm create \
  --resource-group learn-5aa28d33-6685-472c-bcdf-50077e8f7a36 \
  --location southindia \
  --name demoVM2 \
  --image UbuntuLTS \
  --admin-username azureuser \
  --generate-ssh-keys \
  --verbose
How to onboard VMs into Azure VM Insights Monitor
1.Find and select your virtual machine in the Azure portal.
2.Select the demoVM1.
3.Select from the left menu under Monitoring, select Insights > Enable.
4.In the Select Log Analytics workspace, select the Log Analytics workspace you created.
5.Select Enable.

6.Repeat the same steps on demoVM2.
7.Wait 5-10 minutes.
8.In the left menu under Monitoring > Insights, select Refresh until you get results.
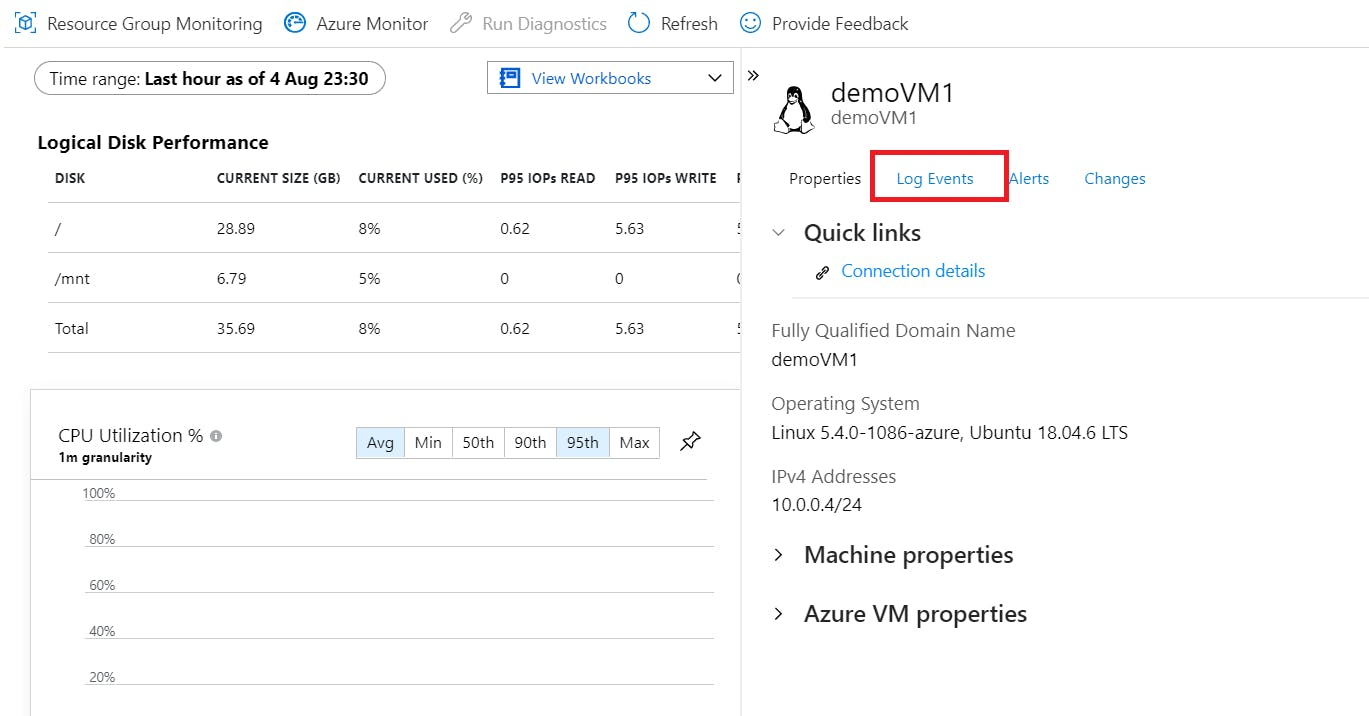
9.View a dependency map, such as running processes, open ports, connection details, virtual machine health, machine properties, and Azure virtual machine properties.
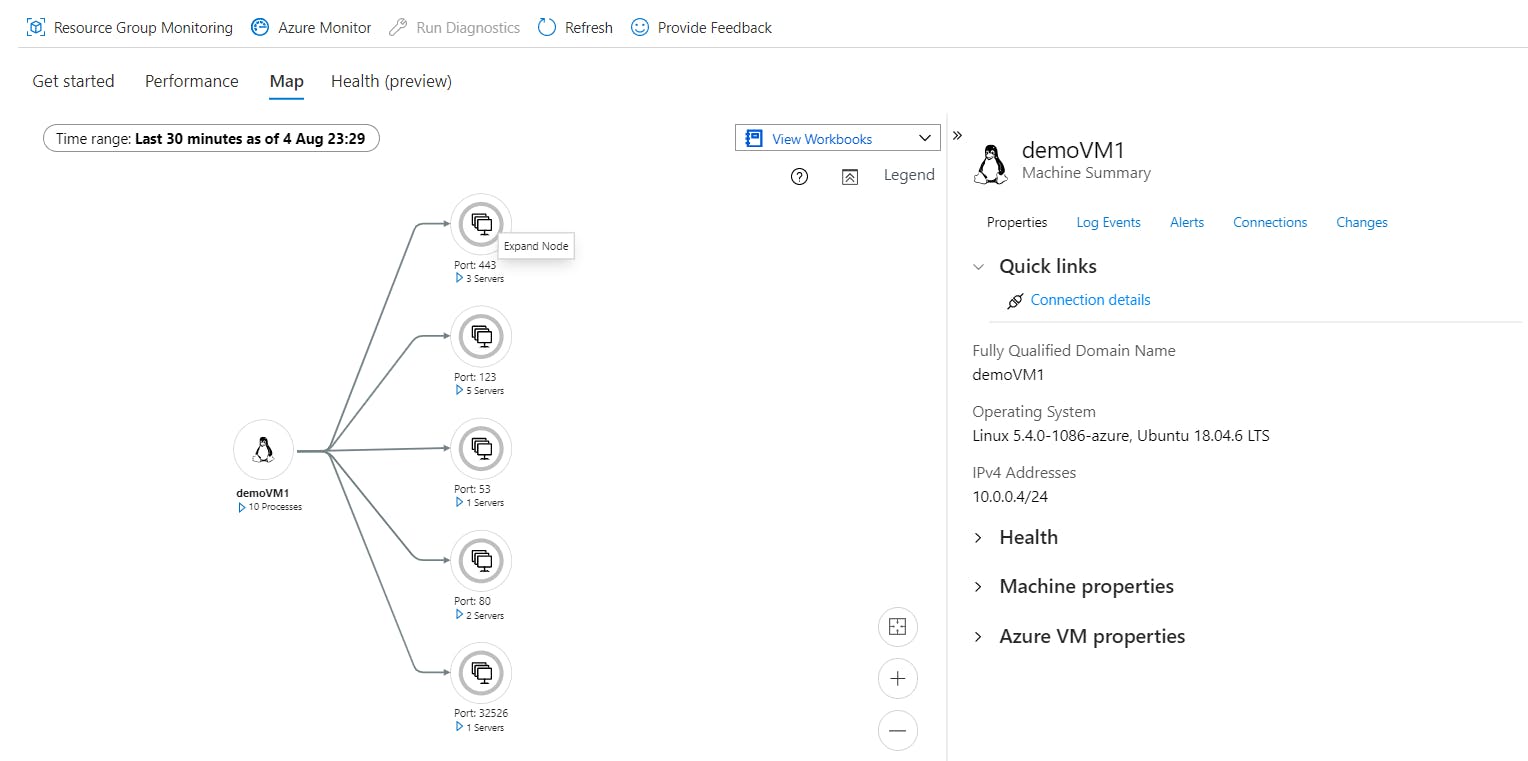
10.Select the Performance tab.
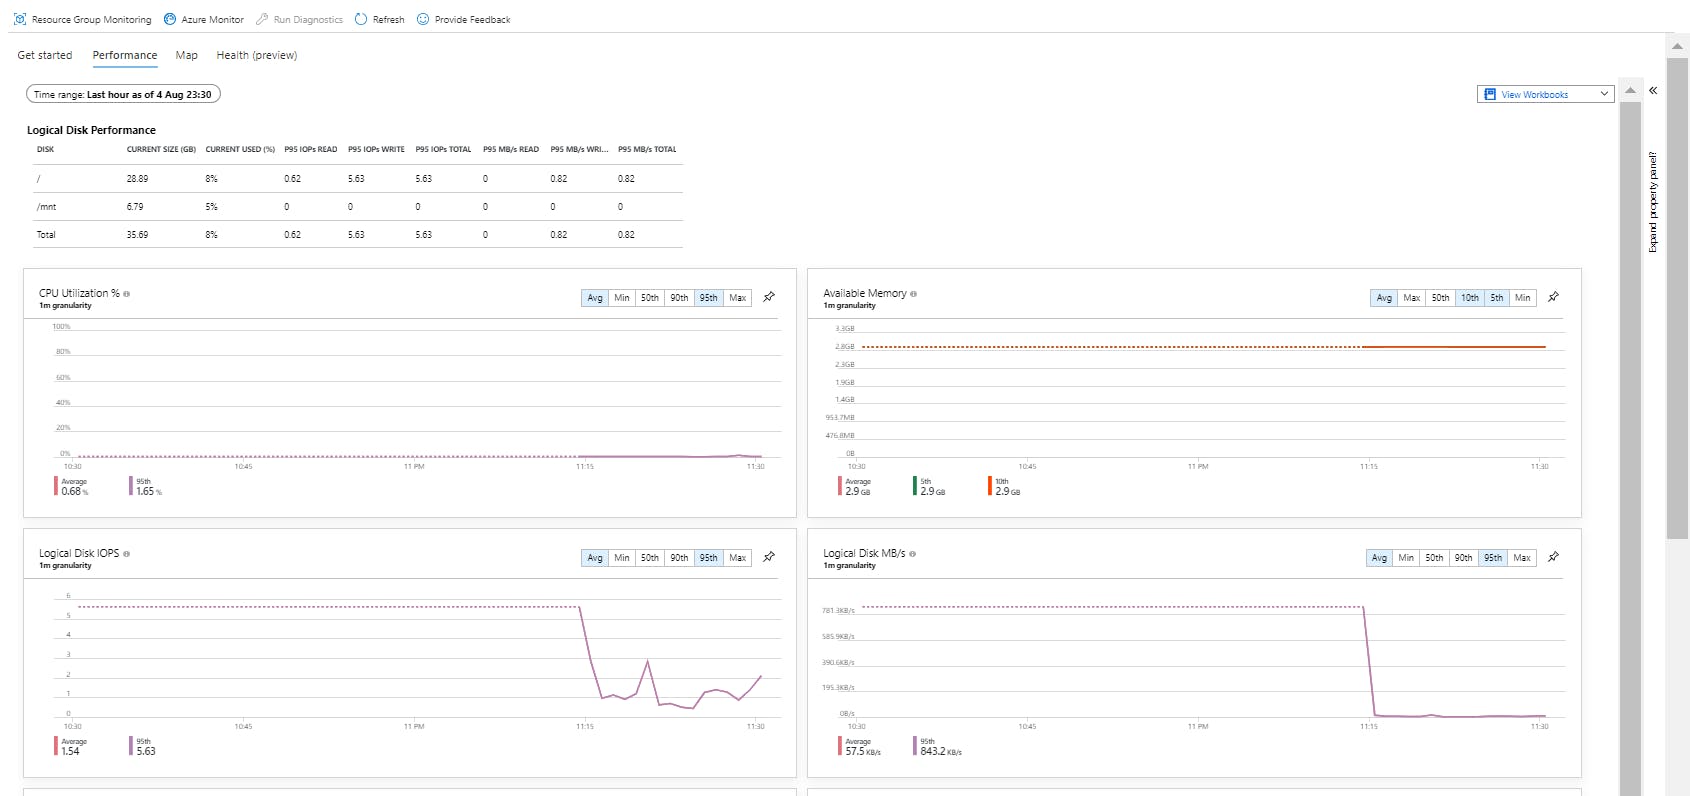
11.Select Event Log.
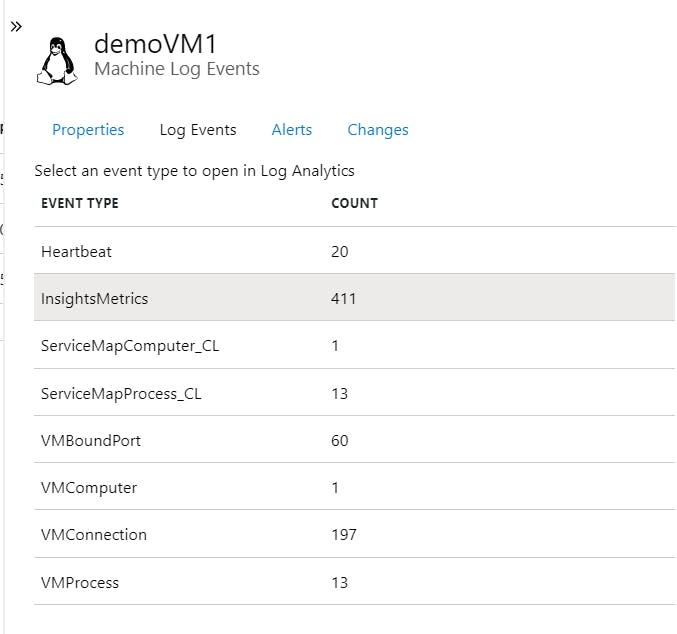
12.Select the InsightsMetrics table.
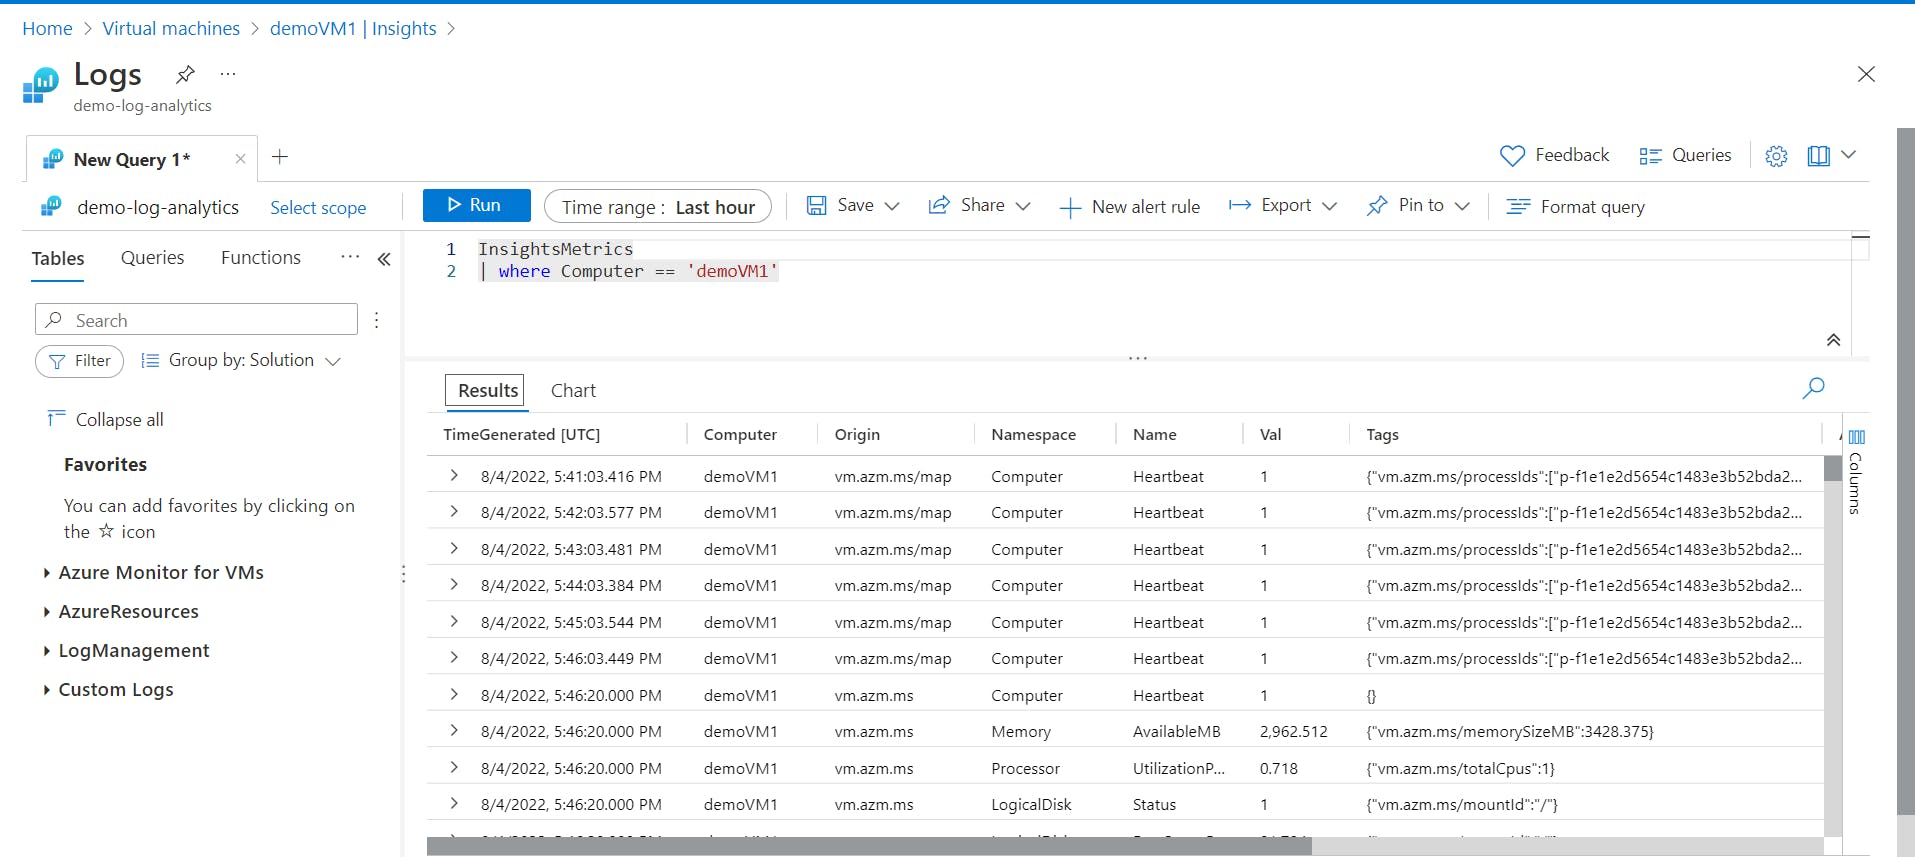
13.The Logs section of the Log Analytics workspace opens with a pre-filled query of the collected data.
Creating log queries with Kusto Query Language
Many Azure services use Azure Monitor Logs to store data and Kusto Query Language to extract data. Microsoft Defender for Cloud, Microsoft Sentinel, and Azure Application Insights Monitoring use Log Analytics workspaces to store and query logs. Azure Monitor Logs rely on Azure Data Explorer. A Log Analytics workspace is equivalent to a database in Azure Data Explorer.
To unlock all functionality with Azure Monitor Logs, you need to use log queries. These queries provide more insight into the data collected in Azure Monitor Logs. The basic query language allows for complex operations with minimal code.
Kusto is a feature-rich language designed to be easy to read and write. All data generated by Azure Monitor logs can be collected and audited using log queries. Write different Azure data sources to different log tables.
Log Analytics is the primary tool used to write log queries and analyze the results. Even if log queries are used elsewhere in Azure Monitor, write the queries and test them with Log Analytics.
How to Create a query using the Query Pane
1.Find and select your Log Analytics workspace in the Azure portal. Select the workspace created earlier.
2.Under General, select Logs. A queries page will open. If you don't see it, select Query in the upper right corner of the logs Editor.
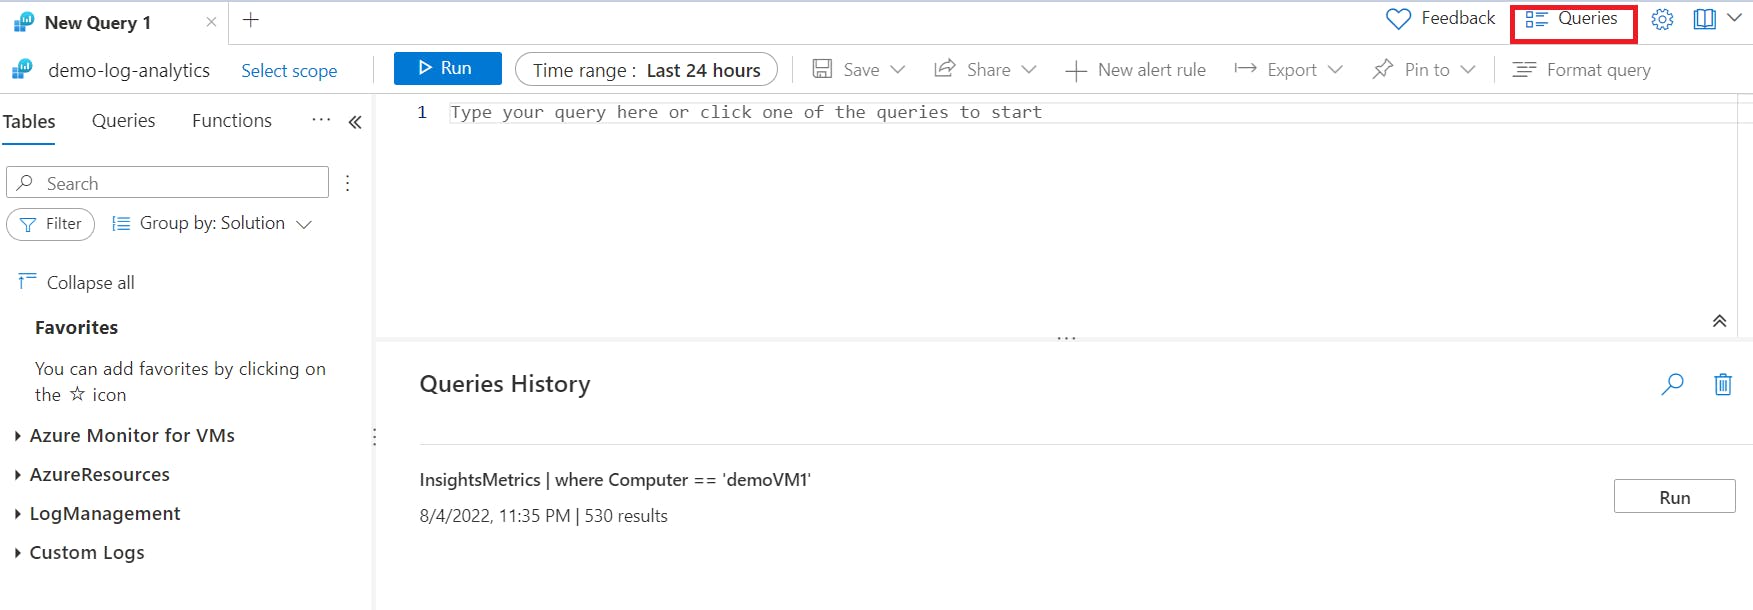
3.Find the category on the top left.
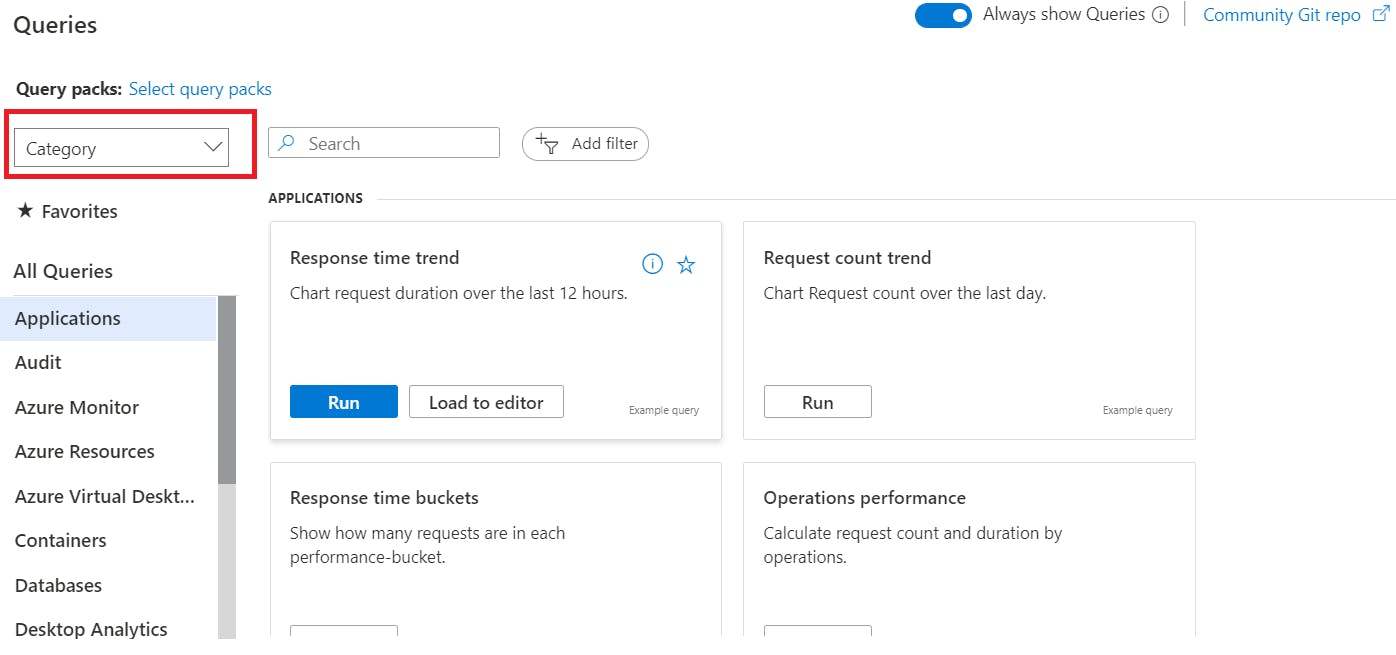
4.Change the filter in the upper left corner of the category to Resource type and select Virtual Machine Scale Groups under All Queries on the far left.
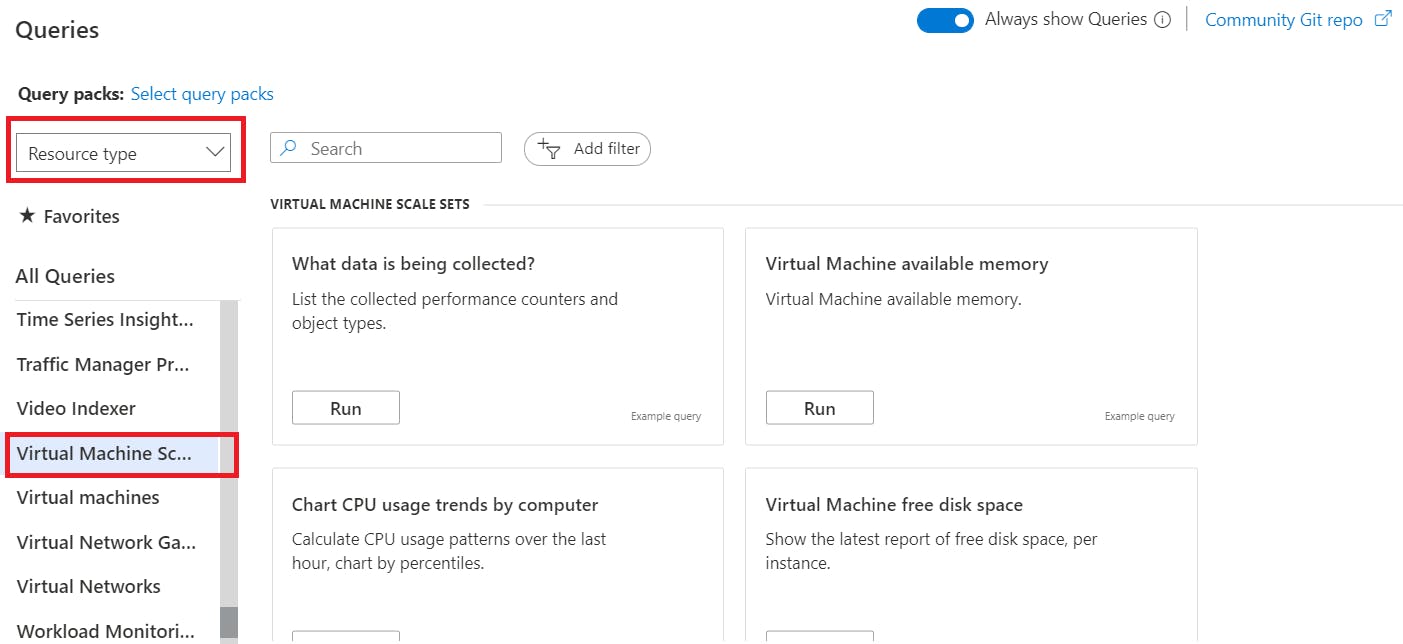
5.Select the Chart CPU usage trends by computer query.
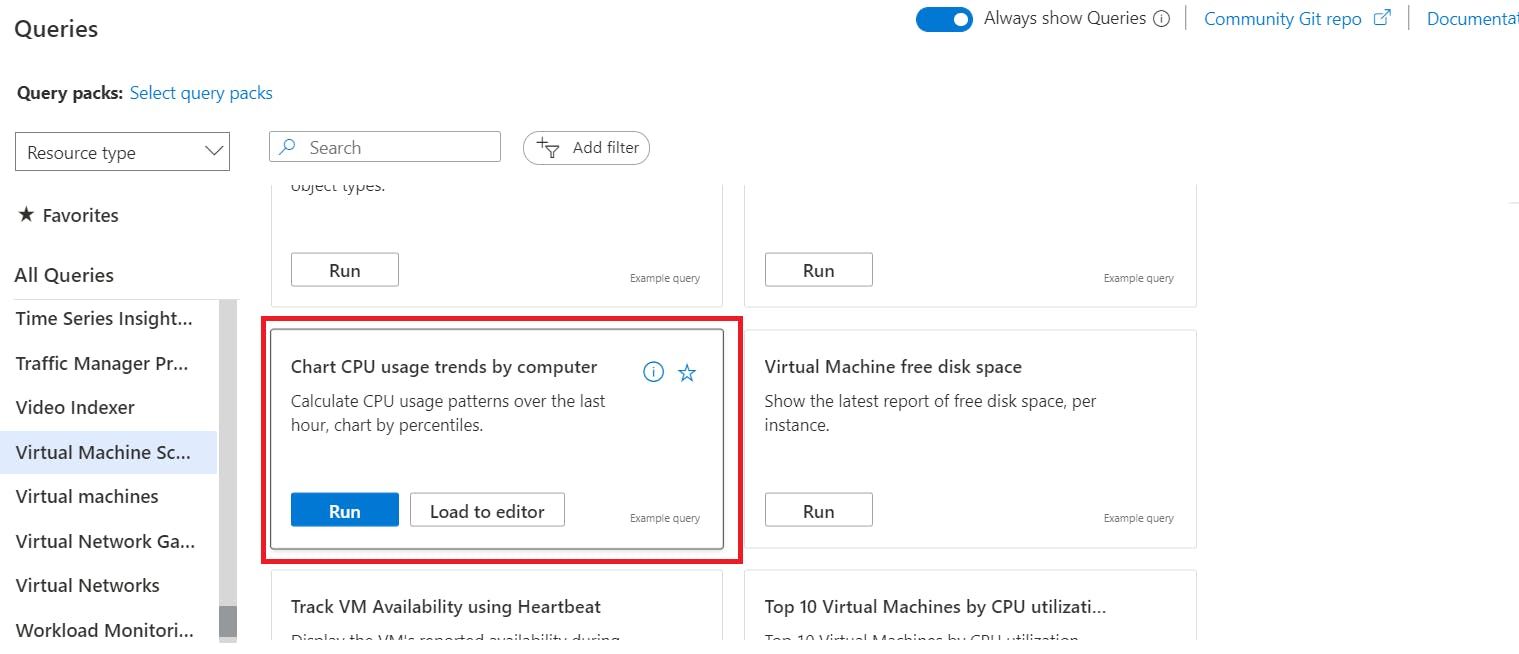
6.Select Run.
7.After running the query, view it in the editor.
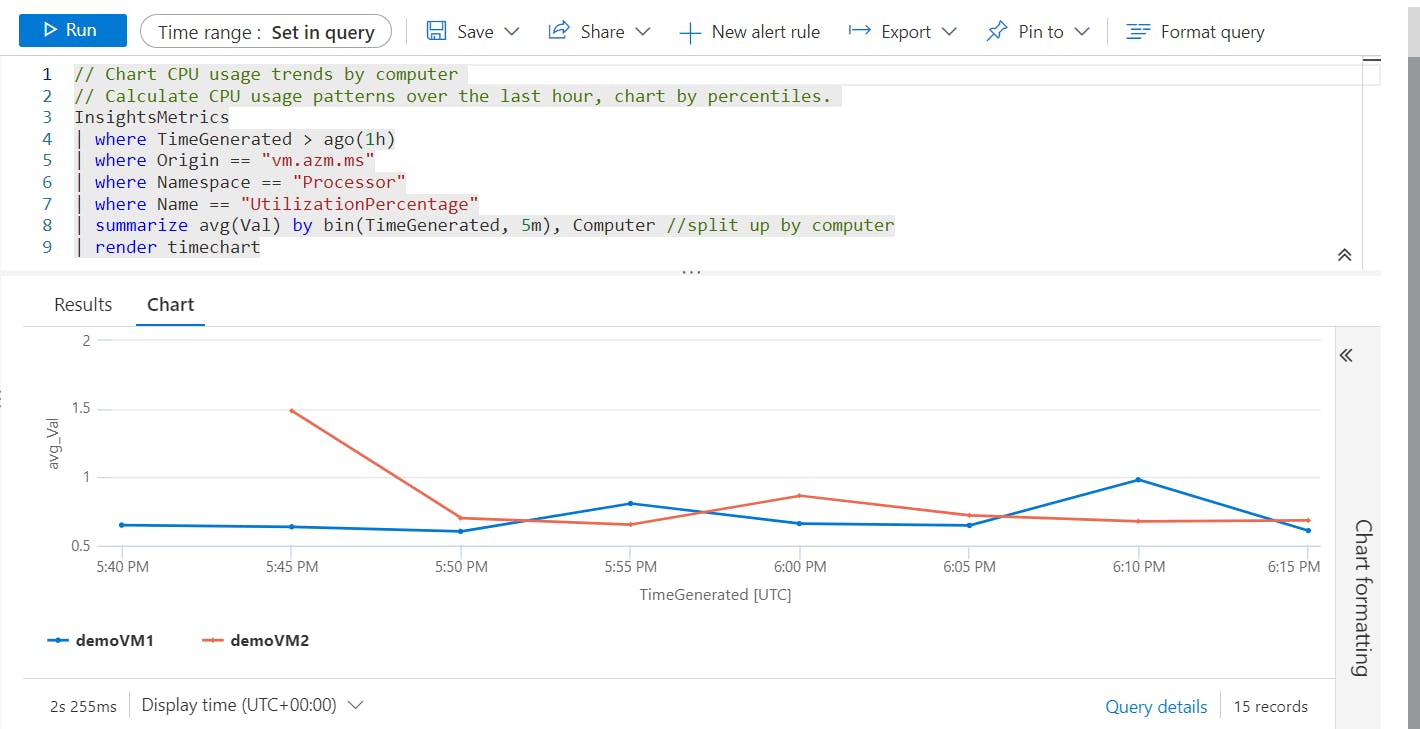
How to modify the query used earlier to create another view of the data.
1.Change line 8 from summarize avg(Val) to summarize max(Val).
2.Select Run.
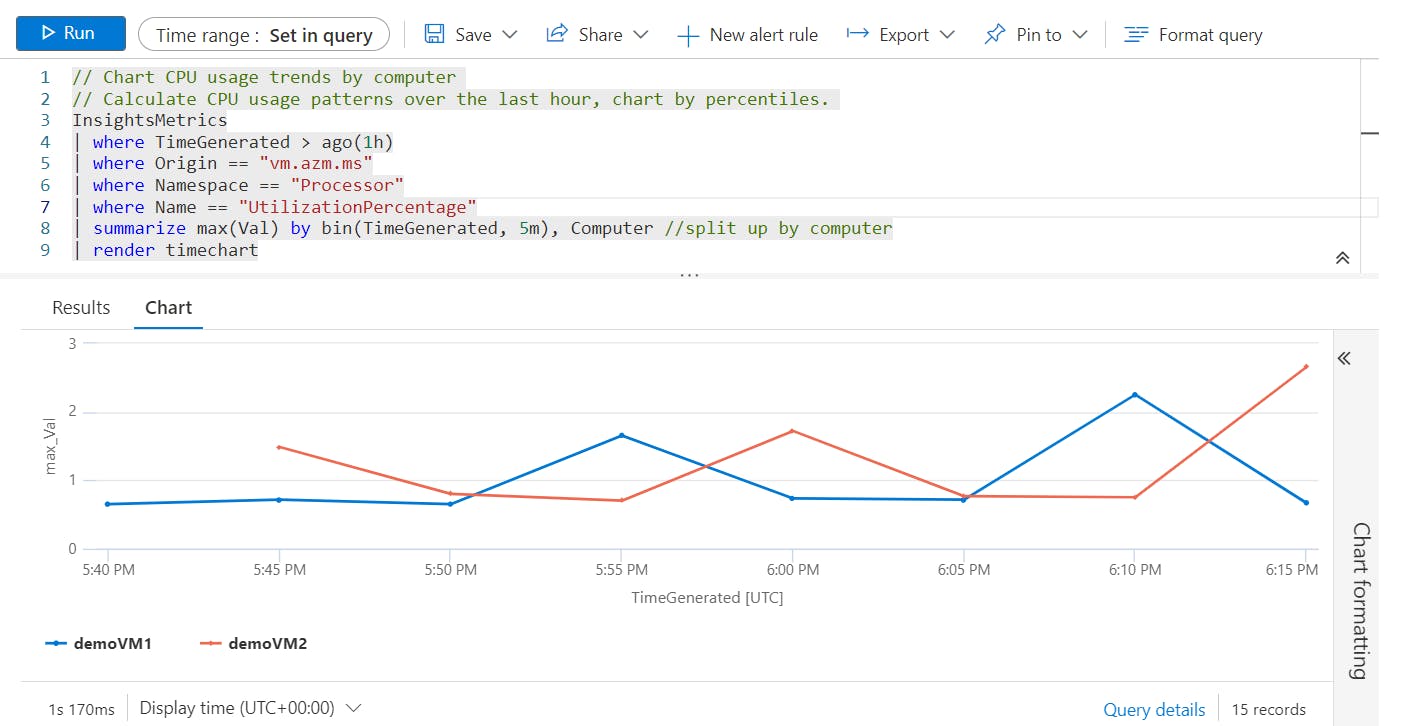
In this article, we've explored native Azure monitoring tools and gained a better understanding of how it all works together from a tool's perspective. I then deployed two virtual machines and a Log Analytics workspace. From there I installed both machines in Azure Monitor VM Insights. Next, we looked at the log queries. This is a great way to delve into the log data generated by Azure resources. You learned how to run a simple query and add multiple operators to filter data in useful ways. From there I tried the query on the average CPU usage part of the query. I then modified my current query to return the maximum CPU usage. By learning to sign in to Azure Monitor and Azure Monitor VM Analytics, you can better understand how Azure can help your business by continuing to provide resources.
Gratitude for perusing my article till end. I hope you realized something unique today. If you enjoyed this article then please share to your buddies and if you have suggestions or thoughts to share with me then please write in the comment box.
